A competitive pricing analysis answers one question for each product you sell. Compared with the stores a shopper would also look at, are you cheap, in the middle, or expensive? And is that where you want to be?
You do not need software for this. A spreadsheet, an afternoon and a consistent method will show you where you stand and give you a short list of prices worth changing. This guide walks through the steps: choosing products, finding the right competitors, recording prices so they compare fairly, building a simple competitor price index, sorting products into cheapest, middle and premium, and deciding what to do next.
What a competitive pricing analysis is (and is not)
A competitor pricing analysis is a product-by-product comparison of your prices against the real alternatives a shopper sees. It tells you your position. It does not tell you whether to move.
That second part needs three more inputs: what each product costs you, what margin you need, and how it is selling. Price position is one input among several. A product can be the most expensive in its market and still be priced correctly if it sells well and your offer earns the gap.
Competition price monitoring is the ongoing version of the same work. You take the snapshot once, then repeat it so you can see who is drifting up, who is discounting, and how often.
Before you start: what to have ready
- Your product list with current price, your delivery charge, and unit cost (what you pay per unit, landed at your door).
- Recent sales by product for a fixed period, so you can link position to results.
- Your minimum margin. Decide the lowest gross margin you will accept before you look at any competitor. It is much harder to hold that line once you have seen a lower price.
- A delivery address to test against. Use the same country and postcode for every check so delivery costs are comparable.
- A private browser window, so you see what a new shopper sees rather than prices shaped by your own browsing.
Step 1: Pick the products to analyse
Do not start with the whole catalogue. Pick a list you can finish in one sitting, chosen for where a wrong price costs you most:
- Best sellers. Small price errors here add up fastest.
- Your highest-priced items. A mispriced expensive product loses more per sale.
- Products other stores sell identically - same brand, model, size. These give clean comparisons.
- Products whose sales have dropped without an obvious reason.
Own-brand or custom products have no exact match. You can still include them by comparing against the closest substitute a shopper would weigh up, but label those rows as substitutes so you read their results with care.
Step 2: Find the competitors in your price band
Your competitors are whoever a shopper sees next to you, product by product. The store that competes with you on one item may not sell your others at all.
For each product, search the way a shopper would:
- By the exact product name or brand and model.
- By a plain description (for example, '1 litre insulated steel water bottle').
- In the country you sell to, with delivery to your test address.
Write down every store that sells a genuinely comparable item. After a dozen or so products, some names will keep coming back. Those repeat stores are your core competitors. A store that appears once might be a coincidence; a store that appears for many of your products is someone shoppers are choosing between you and.
Stay inside a realistic price band. Ignore listings at a fraction of your price (knock-offs, used items, single parts) or at several times your price (luxury versions, bundles). A workable rule of thumb is roughly half to double your price. Outside that range, shoppers are rarely cross-shopping you.
Check the match. Same model, size, colour, pack quantity and condition. A two-pack against a single unit will wreck your numbers.
Decide on marketplaces. If your shoppers compare you with marketplace sellers, include them, but mark them in a separate column so you can view the market with and without them.
There is a fuller walk-through in how to find your competitors.
Step 3: Record prices the same way every time
Inconsistent recording is the main reason a competitor analysis price comparison gives the wrong answer. Set rules and keep them.
- Use the landed price: item price plus delivery to your test address. A low price with high delivery is not a low price to the shopper.
- Record the price the shopper pays today, and note any crossed-out was-price. Flag it as a promotion so you can tell a short sale from a lasting change.
- Record stock status. An out-of-stock offer is not a real alternative. Keep the row but leave it out of your calculations.
- Keep tax treatment consistent. Either all prices include tax or none do.
- Convert pack sizes to a per-unit price where packs differ.
- Date every entry. A price without a date is useless for spotting trends later.
Step 4: Set up the spreadsheet
Use two tabs. The first holds every price you record. The second summarises one row per product.
Tab 1: Observations (one row per competitor offer)
| Column | What to record | Example |
|---|---|---|
| Date checked | The day you looked | Monday's date |
| Product | Your product name or SKU | Steel bottle 1L |
| Competitor | Store name | Store B |
| Marketplace? | Yes / No | No |
| Item price | Price shown today | 29.00 |
| Delivery | Delivery to your test address | 4.00 |
| Landed price | Item price + delivery | 33.00 |
| Was-price | Crossed-out price, if any | 38.00 |
| In stock? | Yes / No | Yes |
| Exact match? | Exact / Substitute | Exact |
| Notes | Anything odd | Sale ends Sunday |
Tab 2: Summary (one row per product)
| Column | What it holds | How to fill it |
|---|---|---|
| Product | Your product | Typed |
| Your landed price | Your price + your delivery | Add the two cells |
| Unit cost | What a unit costs you | Typed |
| Offers counted | In-stock comparable offers | COUNTIFS on Tab 1 |
| Lowest | Cheapest in-stock offer | MINIFS on Tab 1 |
| Median | Middle in-stock offer | MEDIAN of a FILTER on Tab 1 |
| Highest | Most expensive in-stock offer | MAXIFS on Tab 1 |
| Price index | Your landed price / median | Divide the two cells |
| Rank | 1 = cheapest, including you | Count offers below you, plus 1 |
| Position | Cheapest / Middle / Premium | From the index (Step 6) |
| Gross margin | (Price - cost) / price | Formula |
| Margin at median | (Median - cost) / median | Formula |
| Sales this period | Units sold | From your store |
| Action | Keep / Test rise / Review / Watch | Your decision |
In Google Sheets or recent Excel, the median for one product can look like this: =MEDIAN(FILTER(Obs!G:G, Obs!B:B=A2, Obs!I:I="Yes")). That takes the landed prices from Tab 1 for the product in A2, counting in-stock offers only.
If your list is small, a simpler layout works too: one row per product, with a column for each competitor's landed price, and =MEDIAN() across those cells.
Step 5: Build a competitor price index
A price index turns a row of prices into one number you can compare across products:
Price index = your landed price / median competitor landed price
- 1.00 means you sit exactly at the market median.
- Above 1.00 means you are dearer than the typical offer. 1.10 is 10% above the median.
- Below 1.00 means you are cheaper. 0.90 is 10% below.
Use the median, not the average. One store with an odd price (a clearance item, a mistake, a premium reseller) drags an average a long way. The median barely moves.
Here is a worked example with made-up numbers:
| Product | Your landed price | Competitor landed prices | Median | Index |
|---|---|---|---|---|
| Steel bottle 1L | 34 | 29, 31, 33, 38, 42 | 33 | 1.03 |
| Yoga mat | 45 | 52, 55, 58, 61 | 56.50 | 0.80 |
| Pour-over kettle | 89 | 62, 66, 70, 74 | 68 | 1.31 |
The bottle sits almost on the median. The yoga mat is well below every competitor. The kettle is above every competitor.
Two cautions. First, an index built on one or two offers is fragile; flag products with very few comparable offers and do not act on them alone. Second, you can roll product indexes into a store-wide figure (the median of all your product indexes, or a version weighted by revenue). That is handy for tracking a trend from month to month, but it hides the detail. Make decisions at product level.
Step 6: Place each product - cheapest, middle or premium
Pick cut-offs and apply them to every row. A reasonable starting point:
- Cheapest: index below 0.95, or rank 1
- Middle: index from 0.95 to 1.05
- Premium: index above 1.05
Adjust the cut-offs to your market. In a tight market where everyone is within a few percent, a narrower middle band makes more sense. Use the rank column alongside the index: a product can have an index of 0.97 and still be the cheapest offer outright.
Now add one more column: where you want to be for each product. Not every product should be cheapest. A product you sell with faster delivery, better support or a bundle can sit in premium on purpose. A commodity item that shoppers compare on price alone probably belongs in the middle or lower. The gaps between where you are and where you want to be are your to-do list.
Step 7: Decide what to change
Read position and sales together. Some common patterns:
| Position | Sales | What to consider |
|---|---|---|
| Cheapest by a wide gap | Selling well | Test a small rise toward the median; you may be giving margin away |
| Cheapest | Selling poorly | Price is probably not the problem. Check photos, description, delivery time, reviews |
| Middle | Selling as expected | Usually leave it alone |
| Premium | Selling well | Your offer is earning the gap. Keep it and keep watching |
| Premium | Selling poorly | Either make the reason for the gap obvious, or move closer to the median, above your margin floor |
| Any | A rival is cheap only during a sale or while others are out of stock | Wait and check again before reacting |
Before you change a price:
- Check the margin. Work out gross margin at the new price. If it falls below your minimum, the answer is no, whatever the competitors do.
- Move in small steps. A modest change tells you something; a big jump makes it hard to know what happened.
- Change one thing at a time. Note the date. Compare sales over a set period after the change with the same length of period before.
- Do not chase promotions. Matching a rival's three-day sale can leave you at a lower price after their sale ends.
- Watch for a price war. If you cut and they cut back, you both lose margin and nobody gains share.
For how to respond to competitor moves without starting a race to the bottom, see the competitor price monitoring guide.
Mistakes that skew the analysis
- Comparing products that are not the same. Different sizes, versions or pack counts make the index meaningless.
- Ignoring delivery. Comparing item prices only can make an expensive offer look cheap.
- Counting out-of-stock offers. They pull the median toward a price nobody can buy at.
- Including stores your shoppers never see, such as stores in other countries or far outside your price band.
- Acting on a single day's data. One check cannot tell a sale from a lasting change.
- Treating cheapest as the goal. Position is a tool. Profit is the goal.
- Collecting data you never use. Record what feeds a decision; skip the rest.
Repeating it: from analysis to monitoring
A single analysis goes stale as soon as competitors change prices. Decide a rhythm and stick to it: your best sellers and highest-priced items more often, the rest less often, and an extra check before big sale periods in your market.
The spreadsheet method works well while the list is small. It gets heavier quickly, because every product you add multiplies by every competitor you check, and each of those is a manual lookup. Matching products by hand and spotting promotions also take time. For an honest look at the options, from manual checks to scrapers to dedicated tools, read how to track competitor prices.
When a spreadsheet stops being enough
If the checking takes longer than the deciding, a tool can do the collection while you keep the judgement. They differ mainly in who does the competitor research and what happens after a price changes.
- Prisync monitors the competitor URLs or channels you set up, with mature marketplace coverage and rule-based repricing. It suits larger catalogues across marketplaces where you want automated rules. Its URL-based plans started at $99/mo for 100 products when checked against its pricing page in November 2026.
- Priceva monitors competitor sites you configure, with formula repricing and MAP monitoring. Priceva has a real free plan covering up to 20 products and 20 competitor sites (checked November 2026), which makes it a cheap start if you already know who to watch and your catalogue is small.
- Price2Spy is deep URL monitoring with MAP enforcement and screenshot evidence, quoted pricing and paid add-ons. It suits brands policing resellers and teams with large URL lists.
- PriceSway (our tool) starts from your own catalogue instead of a URL list. It searches across the web for each of your products within roughly half to double your price, suggests the stores that keep appearing, re-checks tracked competitor prices about once a day, and shows where your price ranks among the other sellers found online for each product. A daily digest lists meaningful moves, and 90 days of competitor price history can be downloaded as CSV if you want to keep working in your spreadsheet. It does not do MAP enforcement. Plans start at US$49/mo with a 3-day free trial; there is no free plan. How it matches products and measures position is set out in the methodology, and the competitor tracking page covers the monitoring in detail.
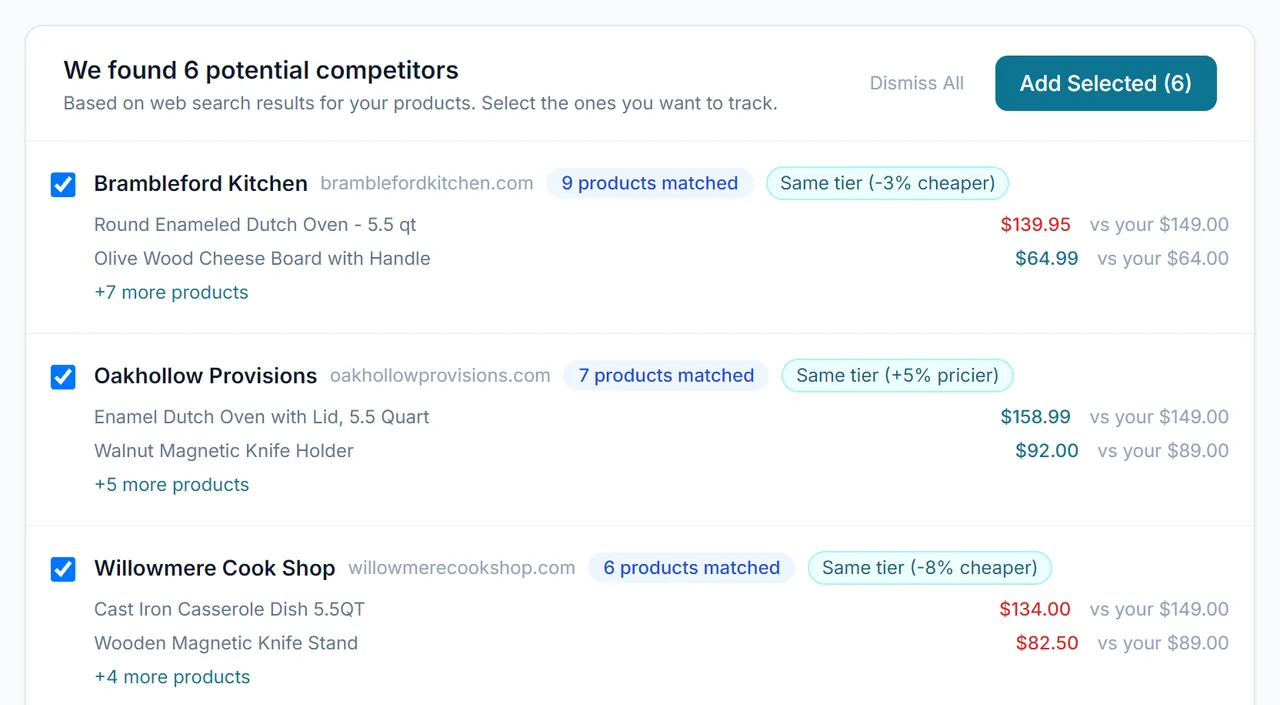
The comparison pages go through each pairing in more depth, including where the other tools are the better pick. If you just want a quick look at your own price structure before deciding anything, the free pricing audit needs only a store URL and no account.
Whichever route you take, the method stays the same: compare like with like, use landed prices, measure against the median, and let margin and sales decide what you change.
Frequently asked questions
What is a competitive pricing analysis?
It is a product-by-product comparison of your prices against the stores a shopper would also consider. It shows whether you sit at the cheap end, in the middle or at the premium end, so you can decide which prices to change alongside your costs and sales.
How do I calculate a competitor price index?
Divide your landed price (price plus delivery) by the median landed price of comparable, in-stock competitor offers. 1.00 means you are at the median, above 1.00 means dearer, and below 1.00 means cheaper.
Why use the median instead of the average competitor price?
One unusual price, such as a clearance item or a pricing mistake, can pull an average a long way. The median is the middle offer, so it barely moves when one store is out of line.
Should my store always be the cheapest?
No. Being cheapest only helps if the margin still works and price is what shoppers decide on. A product with a clear reason to cost more, such as faster delivery or a bundle, can sell well at a premium.
How often should I redo a competitor pricing analysis?
Pick a regular rhythm: check best sellers and high-priced items more often, the rest less often, and add a check before big sale periods. Repeat checks also help you tell short promotions from lasting price changes.
Can I do this without paying for a tool?
Yes. A spreadsheet with the columns in this guide is enough for a small product list. Tools help once manual checking takes too long; some offer free options, such as Priceva's free plan for up to 20 products and 20 sites (checked November 2026).